
Text and pictures © 2004-2026 Guillaume Dargaud
Last updated on 2025/10/27
"We could do the winter-over with just two aspirins, but it's better if we have a little more." — Roberto DiCasilatti, our doctor, upon discovering the hospital totally empty.
This page details the various scientific experiments I installed in december, and which data I'm using. In case you just want the latest Dome C gossips, read on to the 4th part of the story, the 2005 summer campaign
| Project | "Argent9" 2004/6.1 | "Pelleg6" 2004/2.6 |
|---|---|---|
| Resp | S. Argentini | A. Pellegrini |
| Theme | Atmosphere physics and chemistry | Geodesy and observation |
| Title | Study of planetary boundary layer processes at Dome C (STABLEDC) | Antarctic weather-climatology observatory |
![[SodarClose.jpg]
The 3 Sodar antennas, next to each other, with Concordia in the background.](DC2005/SodarClose.jpg)
I already talked about the sodar on various pages since it's an instrument I installed 4 times out of my 5 Antarctic missions. This one is different yet again: it's a multimode Sodar made of 3 antennas in different directions allowing for the computation of the 3-dimensional wind vector at various heights. Similar to the multimode Sodar I installed in DdU in 1993, this one has smaller antennas, a shorter range but also a better definition. Here are some of its characteristics: each antenna emit a 50ms beep on a precise frequency, different for each channel (currently 3050, 4550 and 4050Hz). Then the sodar switched to 'listen' mode and performs a sampling at a special aliased frequency (2833Hz). From the time it takes for an echo to return we know the distance, and from the doppler shift on each of those frequency we know the radial velocity of the layer of air in respect to the antenna. Two antennas are 20° from the vertical so they measure the horizontal component of the wind speed. We also compute the signal intensity returned at various heights. There's plenty of additional post processing done either in real time or off line to determine average wind speed, average wind direction, signal characteristics and more.
Right: The 3 Sodar antennas, next to each other, with Concordia in the background.
![[SodarAcquisition.jpg]
The Sodar acquisition system inside the container: the electronics and amplifier (blue and black boxes), the PC (on the ground) and the old monitor. On the floor the blue boxes are the preamplifiers connected directly to the antennas.](DC2005/SodarAcquisition.jpg)
Left: The Sodar acquisition system inside the container: the electronics and amplifier (blue and black boxes), the PC (on the ground) and the old monitor. On the floor the blue boxes are the preamplifiers connected directly to the antennas.
The Sodar is controlled by a set of electronic boxes that generate the signal, amplify it through a high-fidelity audio amplifier, recover and preamplify the returned signal and sample it before feeding it to the PC. The PC is an old PIII that already didn't work properly in 2000. It still has plenty of problems, one of which is that with Win98 everything slows down to a crawl when I access it via the network, either via VNC to control the program or SMB to recover the data files. I tried to get the acquisition to run under Win2k without success: the driver of the I/O board dates all the way back from... 1993 !
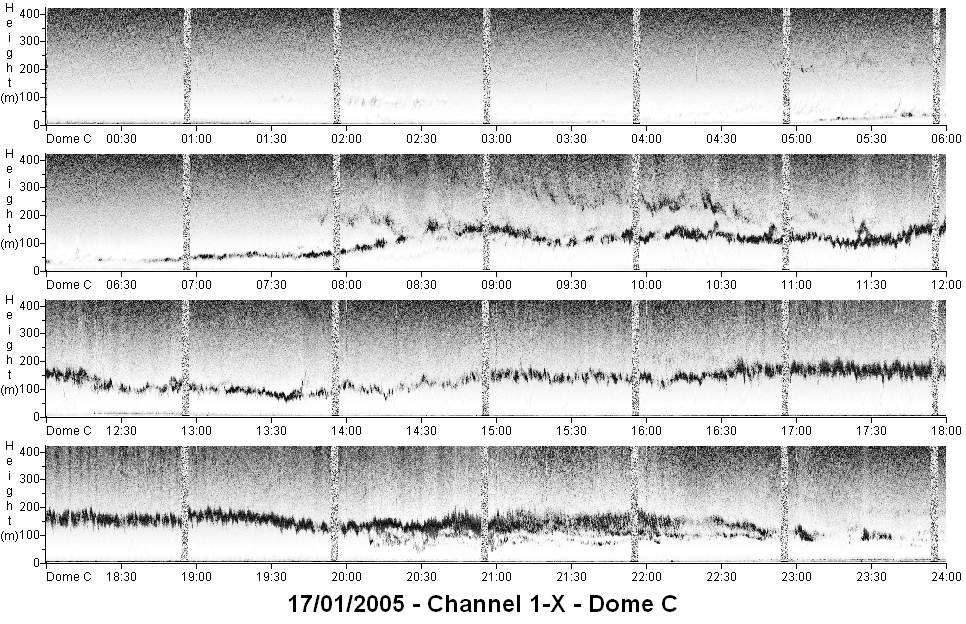
The sodar program can save various kind of files, from the raw acquisition (10Gb/month), the more usual and manageable FFT files, 10 minutes averages or several types of graphical files like the so called 'fax' shown here.
At the end of January I started having problems with the acquisition PC: it would lock up oddly (move the mouse and the PC then starts doing in a hurry what it should have been doing in the last 12 hours...), or lock up during the boot sequence, even with a fresh OS. I suspect this has to do with temperature and moved the computer to a higher position above the stack of electronics of the control system.
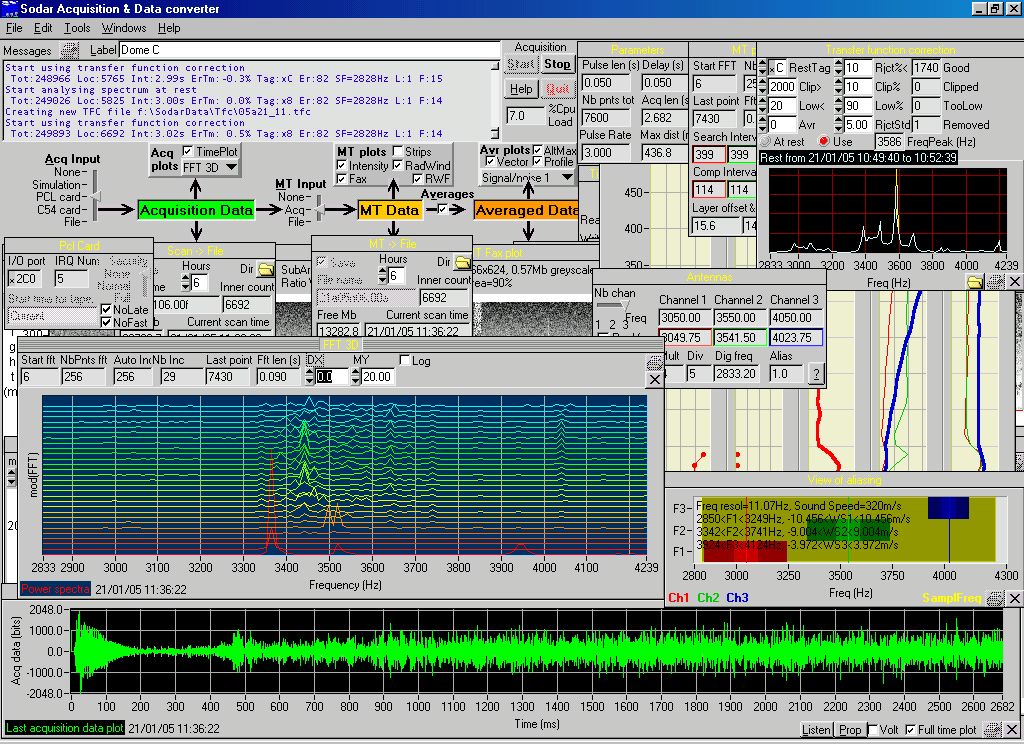
Below: Pass the mouse over the image below to have two samples of Sodar software control. Several panels are for controlling the acquisition parameters while others display the results in various ways: raw acquisition data, post FFT data and averaged data. I wrote this program between 1996 and 1999 and its only update was in 2004 to change the acquisition hardware. In Dome C I still use the old hardware and software.
![[LidarContainer.jpg]
The MicroLidar box, sitting outside the container.](DC2005/LidarContainer.jpg)
Right: The MicroLidar box, sitting outside the container.
The Lidar is a green laser beam sent vertically in the atmosphere. A large tele lens looks up for any returning light, usually sign that a particle (an ice or snow crystal) got into the path of the beam. By measuring the time between the pulse and the blink, you know the altitude of the aerosols.
![[20050406_15_Aerosols.jpg]
Example of 'aerosols' measures by the lidar. This is just a picture of the snow crystals floating in the air, carried by the wind.](DC2005/20050406_15_Aerosols.jpg)
Left: Example of 'aerosols' measures by the lidar. This is just a picture of the snow crystals floating in the air, carried by the wind.
It is the instrument that causes me most problems. Like in 2000 it was thrust on me without much explanation. The user's manual is a post-it with written on it: "Press stop to view the data, press start to stop the program"... At first we couldn't start it but then we figured out that the 'manual' was right: the acquisition starts automatically when the computer is on, and you have to stop the acquisition to start the download of data. It makes sense once you figure it out. But then it started giving trouble, beeping and stopping randomly each time there would be no wind, overheating from lack of natural cooling. Now it seems to be out of focus. And the USB cable is giving trouble from being unplugged too often while frozen. And I have no idea yet of the quality of the collimation.
![[20050406_03_LidarFan.jpg]
The lidar and its fan after moving to the corner of the container.](DC2005/20050406_03_LidarFan.jpg)
![[20051003_004_LidarRed.jpg]
Laser light coming out of a small window through the container, and myself checking if there's any frost of snow on the window. Concordia is visible in the background.](DC2005/20051003_004_LidarRed.jpg)
Left: The lidar and its fan after moving to the corner of the container.
Right: Laser light coming out of a small window through the container, and myself checking if there's any frost of snow on the window. Concordia is visible in the background.
For instance to test the focus, I had to bring it inside and tape some measuring paper on the reception lens. Then bring it back outside still half taken apart and run series of tests changing the focus every five minutes. The catch is that I have no idea how to analyze the data, so I have to send it to Italy where they tell me if it's good or bad.
In mid-february, with the cooling days, I got fed up of having to go every day to the container to fix it, spending 2 hours in the process (it takes time to bring it inside and let the temperature adjust). I decided to keep it inside and drill a hole in the ceiling of the container. I removed the UV filter from the Lidar cover, with the idea of mounting it on the roof, but I broke it while working on it. The Lidar has been offline ever since while I was waiting for news about what to do from the lab. News that took 3 weeks to arrive since all the emails got lost.
After I get the go-ahead, it's already hard to work outside, the 'warm' summer days are long gone. I spend a few hours taking measurements so I don't have to spend too much time working on the roof of the container in -60°C wind. I drill a small hole through the ceiling from the inside of the container. Then I go on the roof with a 10cm diameter drill and a powerful tool. Too powerful: when it locks up, and it happens about 15 times, I just fly off the container. After more than an hour I've drilled through the steel and wood of the container, but my arms feel like they've been broken over and over and the side of my face exposed to the wind is freezing through the mask. I get back inside to prepare a window over the hole, held in place with some silicon glue. After only a few minute there's already ice deposit inside. The next day I'm back with a heated fan to solve the condensation problem and the lidar, now on its small platform in the corner of the container, is back online after a month long hiatus.
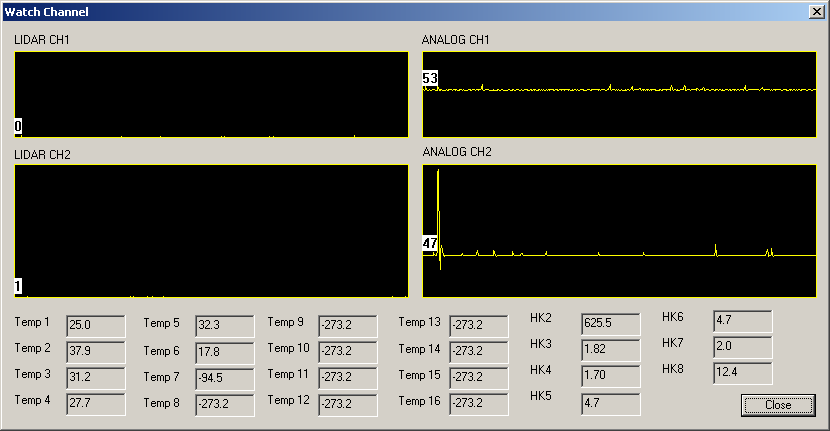
Below: Screenshot of the Lidar program.
![[RadiometerConcordia.jpg]
The radiometer with Concordia in the background.](DC2005/RadiometerConcordia.jpg)
![[RadiometerAcquisition.jpg]
The radiometer acquisition PC in the container.](DC2005/RadiometerAcquisition.jpg)
Left: The radiometer with Concordia in the background.
Right: The radiometer acquisition PC in the container.
I'm not very familiar with the radiometer: it's an instrument I discovered here and it works fine so I haven't had to put my hands in it. A Teflon box protects a small parabolic antenna which runs from horizontal to vertical position every 10 minutes. This antenna can measure the black body temperature of the atmosphere, integrating it from the ground to a height of 600 meters. If the reference ground temperature is taken precisely it can give precise vertical temperature profiles.
Below is an example of 24 hour profile. Each line on the top plot is an altitude. The two odd jumps are places where we'll need to recalibrate the ground temperature. The profile shown on the left is typical of the night: a very cold ground temperature, temperature raising sharply till a height of about 100 meters, then constant. During the day it's the opposite: the ground is warm and the temperature decreases quickly till a height where it starts raising again slowly.
![[ScreenShotRadiometer.png]
Radiometer screenshot.](Graphs/ScreenShotRadiometer.png)
![[20050321_13_CR23Download.jpg]
I'm up the mast to clean the ice accumulated on the sensors while an old PC loaded on the snowmachine strives to download the data off the CR23 before it freezes to death.](DC2005/20050321_13_CR23Download.jpg)
Right: I'm up the mast to clean the ice accumulated on the sensors while an old PC loaded on the snowmachine strives to download the data off the CR23 before it freezes to death.
More coming soon![[MeteofluxSetup3.jpg]
Setting up the meteoflux and CR10 box.](DC2005/MeteofluxSetup3.jpg)
Right: Setting up the meteoflux and CR10 box.
Coming soon![[MeteofluxAcquisition.jpg]
Acquisition system of the meteoflux.](DC2005/MeteofluxAcquisition.jpg)
Right: Acquisition system of the meteoflux.
![[MeteofluxConcordia2.jpg]
The meteoflux mast and Concordia in the background.](DC2005/MeteofluxConcordia2.jpg)
Left: The meteoflux mast and Concordia in the background.
![[ScreenShotMeteoflux.png]
Meteoflux screenshot.](Graphs/ScreenShotMeteoflux.png)
Right: Meteoflux screenshot.
I installed two 30$ webcams directly outside, unprotected, to see whether their cheap electronics would withstand the cold. Surprisingly they give better images than inside ! Much less noise on the image. This is just the Antarctic equivalent to using Peltier-cooled CCDs !!! One webcam is at the scientific container and points towards Concordia; the other is outside the window of my 3rd floor laboratory. The main problem I have is that they are not sensitive enough at night (the image is all dark) and too sensitive during the day (it's completely washed out), so I had to decide and place a dark filter on the lens.
I used the free program Dorgem to acquire an image every minute, a custom prog to insert weather conditions onto the image, and a simple Matlab script to assemble them into a video. The images are used mainly to monitor cloud activity and for instance it's been useful when I saw sudden jumps in temperature on the weather station: I could actually see the smoke of the power plant move over the station a km away.
Right: sample webcam video of Concordia taken over 24 hours on February 20th 2005. No, there's no sound, and no I cannot transmit realtime webcam images because we don't have a permanent connection here. If you liked that, here's a fantastic time-lapse video of Antarctica.
![[20050405_09_Balloon.jpg]
Balloon launch in the evening. The little white dots are not stars but snowflakes illuminated by the flash.](../Photo/640/20050405_09_Balloon.jpg)
Right: Balloon launch in the evening. The little white dots are not stars but snowflakes illuminated by the flash.
This is the classic launches that happen all over the world at the same time of day to gather data for the global model weather forecast predictions. I was asked in late november to perform those launches and the equipment was ordered and delivered at the last minute (with some missing balloons). The Vaisala acquisition station was installed in the Concordia lab in the last days of the summer campaign, the helium for the balloons arrived on the last Traverse. It's an experiment I share with Karim: I launch classic weather probes that return temperature, humidity, pressure and GPS position; while he launches specially modified probes that also return very precise turbulence data. We started the launches in late March and we are somehow restricted by the lack of balloons and the lack of helium. He launches his balloons on mondays and thursdays while I launch mine on tuesdays, wednesdays and fridays.
![[20050923_009_MovingHelium.jpg]
September 2005, the three racks of helium emptied during the winter for the balloon launches are being moved out of the garage tent and replaced with full ones.](DC2005/20050923_009_MovingHelium.jpg)
Left: September 2005, the three racks of helium emptied during the winter for the balloon launches are being moved out of the garage tent and replaced with full ones.
Here's the sequence of events for one of my launches: I get the probe out of its package, hook it to a communication cable in a non-humid box, start the software, calibrate the probe, put its saline battery inside water to start it, get dressed for outside, hook the battery to the probe and close it, verify the radio data feed, go to the garage with the probe and the balloon, hook the balloon to the helium pipe, inflate it, tie it with a string, attach the probe, open the bay doors, walk outside and release the probe.
Karim's launches are more complex: he takes a standard probe and attaches modifications to it (an extra battery, a radial axle with extra sensors on it, more control electronics), then we go down and inflate the balloon which is 3 times mine in volume as it needs to lift a heavier load, he then goes back to the lab to finish the preparation of the probe by inserting his very fragile tungsten thermometers on top of the probe, he then sends down someone carrying carefully the probe between the narrow doors and stairs, once the probe is outside Karim verifies the data received and then walks down. We hook a 100m roll of thin wire to the balloon, open the bay doors and walk outside trying not to puncture the balloon on the sides of the doors. We walk 100m away from each others, tie the wire to the probe (in the outside cold) and start releasing the balloon. If there's no wind it's easy, but otherwise we need to find the right distance and angle at which to release it as the fragile sensors absolutely must not touch the ground upon release.
After this we clean up, walk back inside, undress and monitor the probe data feed. The GPS gives us its distance and, more important, its height. Here the balloons seem to all reach 25000 meters, after which they blow up and fall down, still transmitting data as they plummet down to Earth. No risk of them hitting a penguin as they don't usually go more than about 40km from the station. The probes are single use and consequently lost.
Below: Example of radiosonde results for April 12th. The height reached by the balloon is 25km and there are two overlapping lines: one on the way up and one on the way down. The base altitude is sea level and we launch from 3260m. As seen on the radiometer, the temperature increases sharply between ground level and about 250m, then decreases without reaching the extreme temperature found on the ground (-66°C at the time of launch). The other values (humidity, wind speed and direction) also change drastically in the first few hundred meters.
![[Sounding.png]
Example of radiosonde results.](Graphs/Sounding.png)
![[20050406_10_WeatherStation.jpg]
The Concordia weather station.](DC2005/20050406_10_WeatherStation.jpg)
Left: The Concordia weather station.
During the summer campaign there are two weather forecast stations used by the Radio room to alert the airplanes of current conditions. Those two are being shut down for the winter, but replaced by a new station installed at the end of january. The software for this station is truly minimal: just the hyperterminal displaying the data coming from the station through a serial line. Not even saving the data. In a few hours I hacked together a program to acquire, store and plot the resulting data, which is the usual temperature, humidity, pressure and wind. The difference is that this station has a set of normal anemometer / wind direction and and another set which is heated to see if they perform better in winter because deposit of ice often false the results.
![[ConcordiAWSday2.png]
Concordia weather station acquisition screenshot (Javascript animation) with some commented events. The blue plot is the windchill.](Graphs/ConcordiAWSday2.png)
Left: Concordia weather station acquisition screenshot (Javascript animation) with some commented events. The blue plot is the windchill.
![[AWSuncleanWind.png]
AWS acquisition screenshot showing dirty and clean data (Javascript animation)](Graphs/AWSuncleanWind.png)
The Automated Weather Stations (AWS) are one of my oldest Antarctic experiment. Back in 1993 I wrote a program to directly acquire the data feeds from the NOAA satellites in Dumont d'Urville. When I went thought DdU in 2000 I had the pleasure to see my program still in use, having survived the Y2K bug. The history of the AWS stations in Dome C is interesting: the first station was installed in january 1984 and was using a nuclear isotopic thermogenerator of the same technology than is used on board of deep-space spacecrafts, like Voyager. Then came the Antarctic Treaty, banning the use of radioactive materials in Antarctica and the generator was replaced by a large battery. Then a couple years later the old AWS station was replaced by a new one at the current location of the Franco-Italian station (the other was near the American Dome Charlie).
![[AWScleanTemp.png]
Cleaned up AWS data](Graphs/AWScleanTemp.png)
AWS data can be acquired locally, like in DdU, if you have the proper reception equipment which we lack in Dome C, so to access the data I rely on the two months delay of the ftp site of the University of Wisconsin. Not the easiest solution. Another part of the problem is that the data is very dirty: it relies on very old satellite protocols and errors creep into the messages by the truckload (about one message out of two has errors). The AMRC is supposed to clean the data but they seem to have stopped doing that a few years ago. It's not like the AWS data is all that informative, it only contains wind speed, wind direction, temperature and pressure, but for the last 20 years, it's the only recording of winter weather that we have, so it's important to continue it so we can compare it with the new acquisition systems that will start with the opening of Concordia.
![[AWShistTemp.png]
Temperature histogram at Dome C, normalized in number of occurring days per year. For instance you notice two plateaus, once where the temperature ranges between -25 and -40 which corresponds to summer temperatures, and one from -55 to -70 with winter temperatures. Note that the winter has a lot more days than the summer... Only rarely does the temperature falls below -80°C, a few hours per year.](Graphs/AWShistTemp.png)
Right: Temperature histogram at Dome C, normalized in number of occurring days per year. For instance you notice two plateaus, once where the temperature ranges between -25 and -40 which corresponds to summer temperatures, and one from -55 to -70 with winter temperatures. Note that the winter has a lot more days than the summer... Only rarely does the temperature falls below -80°C, a few hours per year.
So even though I get the data off an official data server, I need to clean it pretty heavily. Here's are 3 views of the AWS data cleaning program I hacked in an afternoon. Pass the mouse over the first plot above (JavaScript animation) to see the difference between dirty and clean data: there are some wind speed peaks (dark blue) totally out of range, as well as the wind direction that drops to a meaningless 0 or 360 very often. This is just one month of data (July 2001). The second plot displays cleaned data off a typical winter in Dome C (August 1984) with temperature dropping below -80°C several times during the month. Maybe I could have used my old 1993 AWS program to clean the data, it worked fine for that purpose, but I rewrote the same thing from scratch in about 4 hours and spent the next 8 hours cleaning the 215 months of data.
![[AntarcticaRadarsatDEMmapping.jpg]
Perspective view of Antarctica obtained by combining elevation data and radarsat data. The orientation is such to show DdU and Dome C in the foreground.](MapSatellite/AntarcticaRadarsatDEMmapping.jpg)
Right: Perspective view of Antarctica obtained by combining elevation data and radarsat data. The orientation is such to show DdU and Dome C in the foreground.
I don't use RadarSat data directly for my work, but sometimes as localization reference. I already have a page with plenty of images extracted from the main RadarSat dataset (ant125mV2.bin). Recently I started using the elevation dataset (ramp200dem_osu_v2.bin) and modified my original program to enable 3-dimensional display as well as external file mapping. There will soon be a tutorial and upgraded version of LargeImage.exe.
I might actually start a project next year involving geolocating the Traverse very precisely in order for it to either stick to its own tracks (which disappear quickly in the storms for the first 600km of the trip) or to avoid hills by going around them. The problem is that hills are not visually visible in this flatland but even a 1% slope in soft snow can cause trouble to the Challenger vehicles pulling a hundred tons of loaded sleds. The radarsat elevation data is precise to 1m, which is enough to see the hills, part of the problem is to geolocate precisely the vehicles on it.
Another part of the problem is to find the past tracks. Even when the tracks are covered by 20cm of fresh snow, it's much better to drive onto them than out on untrodden snow where the sleds can tip over and the Challenger start digging themselves into the ground. GPS is not precise enough to follow a 5m large track, wands get blown away by the wind, infrared cameras don't show anything... Salvation may come in the form of a microwave imager which is being researched. The passive microwaves can actually tell the difference between compacted snow and fresh one. We'll see.
![[TemperaturesCPU.png]
CPU temperature monitoring, for geeks only](Graphs/TemperaturesCPU.png)
Right: CPU temperature monitoring, for geeks only
Of interest for hackers only, here's a small graph showing the temperature of the CPUs of the acquisition PCs that are inside the container. To give you an idea my PC running at a normal temperature runs at about 50~60°C. Those machine are inside a heated container, but the temperature inside it so low that the CPU temperature sometimes drops below freezing... And all hell breaks loose ! With the low humidity here, there isn't much condensation to be afraid of, but I still get random crashes on one computer when this happens. No need to watercool your CPU in Antarctica; on the other hand it's rather uncomfortable spending the entire day working inside the container. Note that this graph is a 24 hour average, the difference between day and night on the CPU is about 8°C. Also when the CPU goes below 0°C, many thermal probes just don't show the proper temperature anymore, they confuse it with 255°C or some such.
Read on to the 4th part of the story during January.
